L
o
a
d
i
n
g
.
.
.
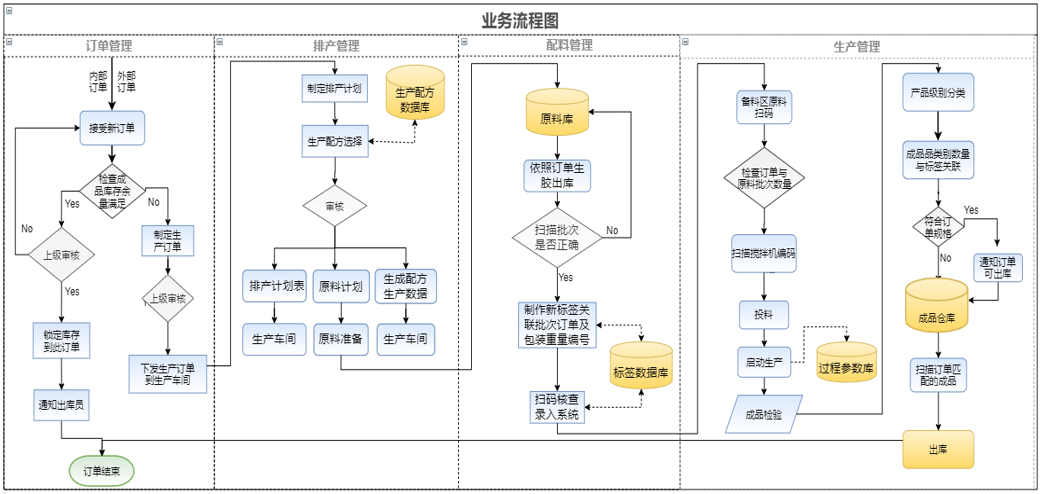
1、System Functions
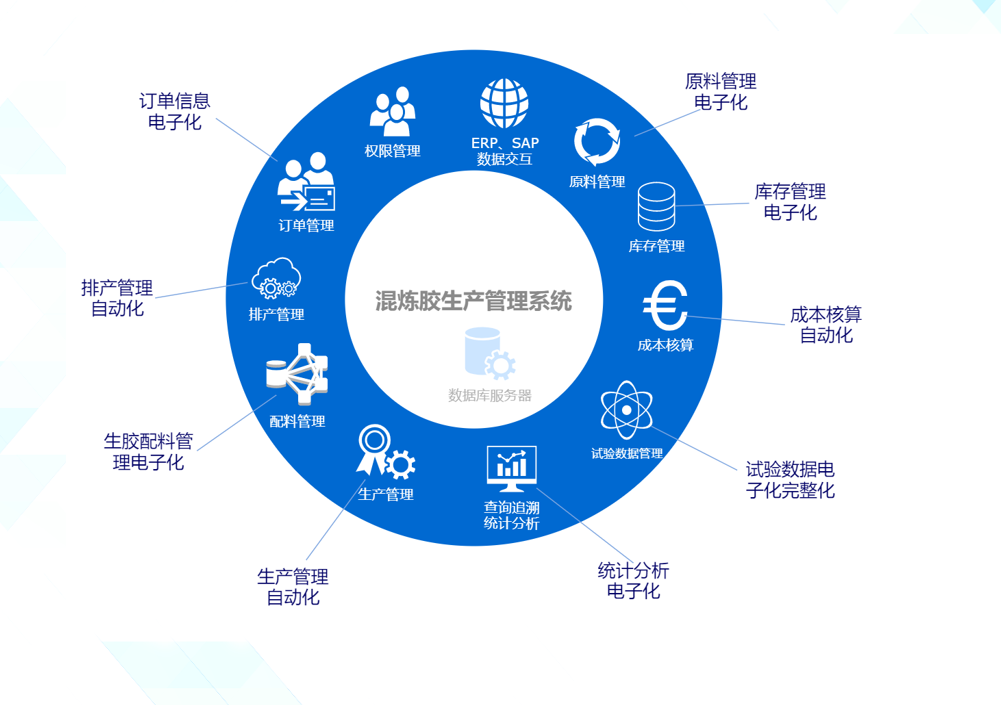
2、Production Process Flow Chart
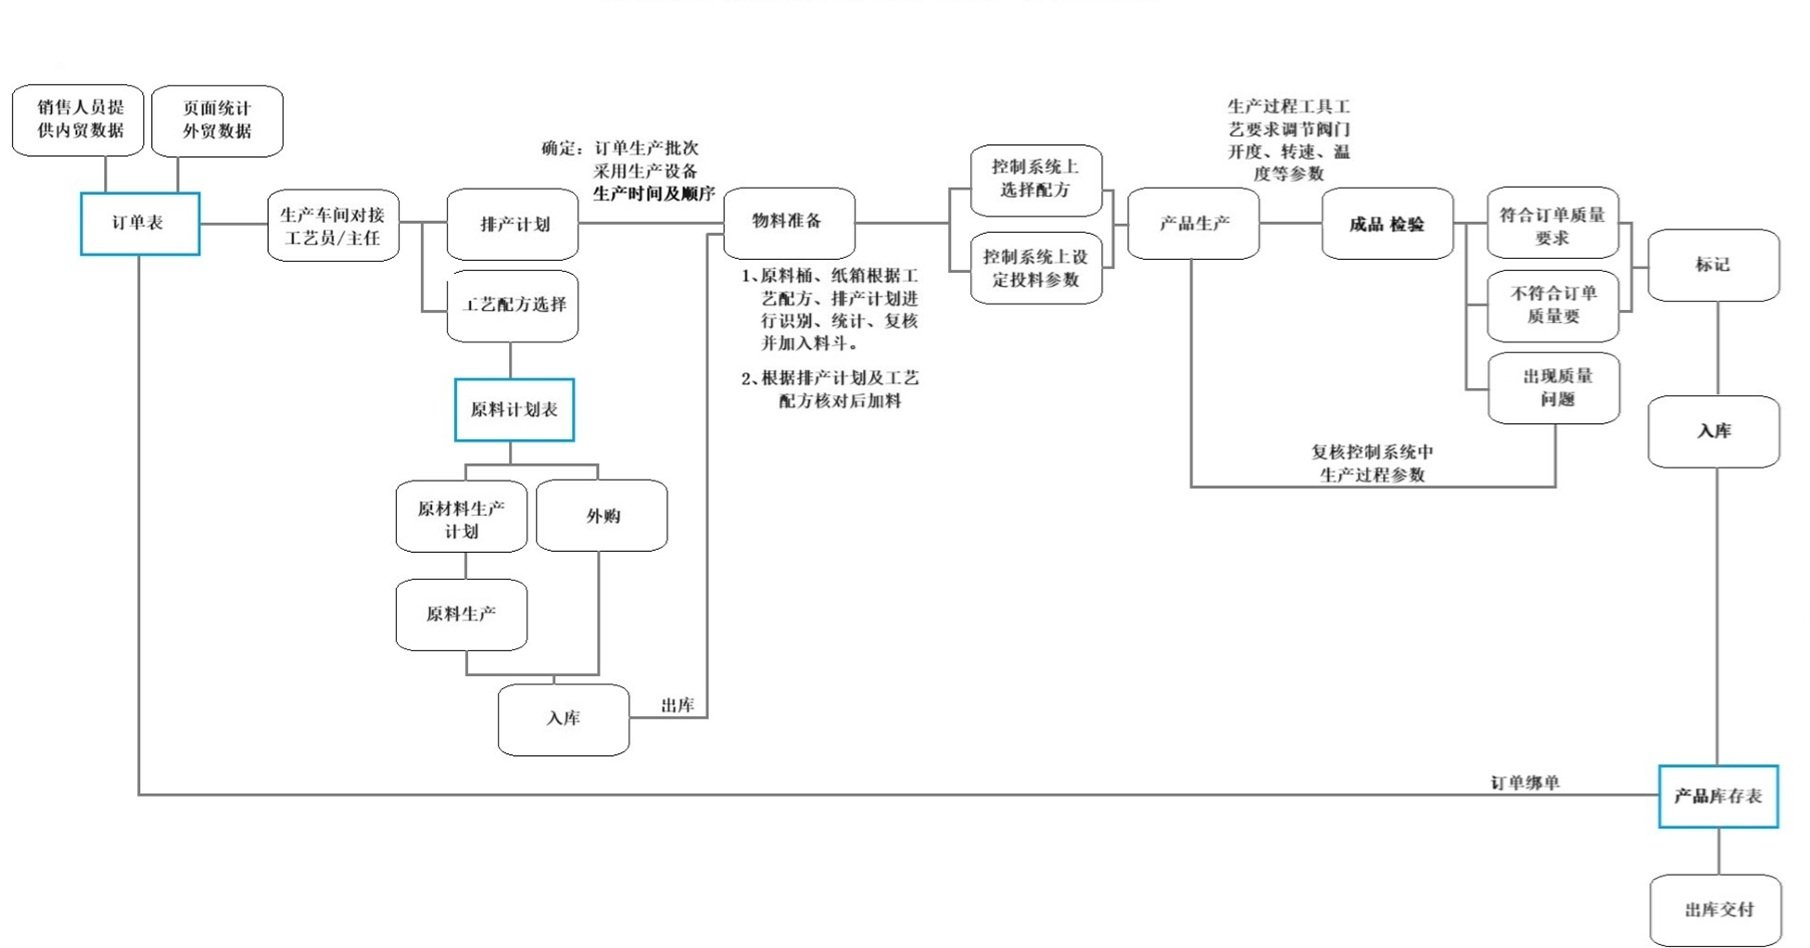
2.1 Order Process
1.An order management system that realizes electronic order generation and order distribution.
2.Establish an order management database to achieve electronic and visual order traceability and order tracking.
3.Associate the order management database with the finished product database to avoid inventory waste.
4.Implement hierarchical order management; special orders and regular orders are classified into different levels to facilitate differentiated response and processing during production scheduling.
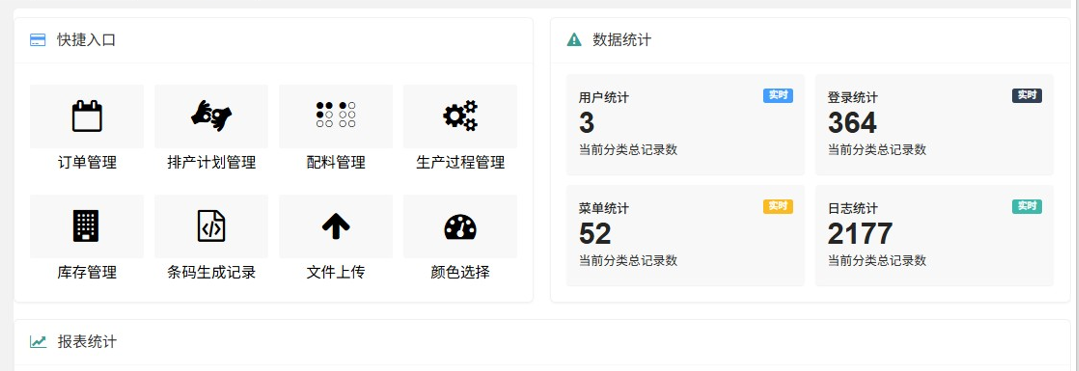
◇ Receive orders, which are divided into domestic trade orders and foreign trade orders. Crawler technology can be adopted to collect information of foreign trade online orders and improve the real-time performance of online order collection.
◇ Automatically check finished product inventory according to the product model, specification and quantity specified in orders. Bind available inventory if stock is sufficient; otherwise, generate new production orders, and form the order management database.
◇Support inquiry and traceability of historical orders.
◇Support real-time inquiry of order status to realize visual order production management.
2.2 Production Scheduling Process
1.Realize electronic production scheduling management and automatically generate production schedules.
2.Establish a formula management database to digitally manage formula information, support formula inquiry and record formula version updates. The system allows querying and printing formula data, and automatically selects matching formulas based on orders.
3.The formula management database links formula data with key modules including cost accounting, production raw materials and production orders.
4.Automatically generate raw material usage plans according to orders, build a production raw material management database to record raw material inventory and consumption status, and synchronize data with the SAP system.
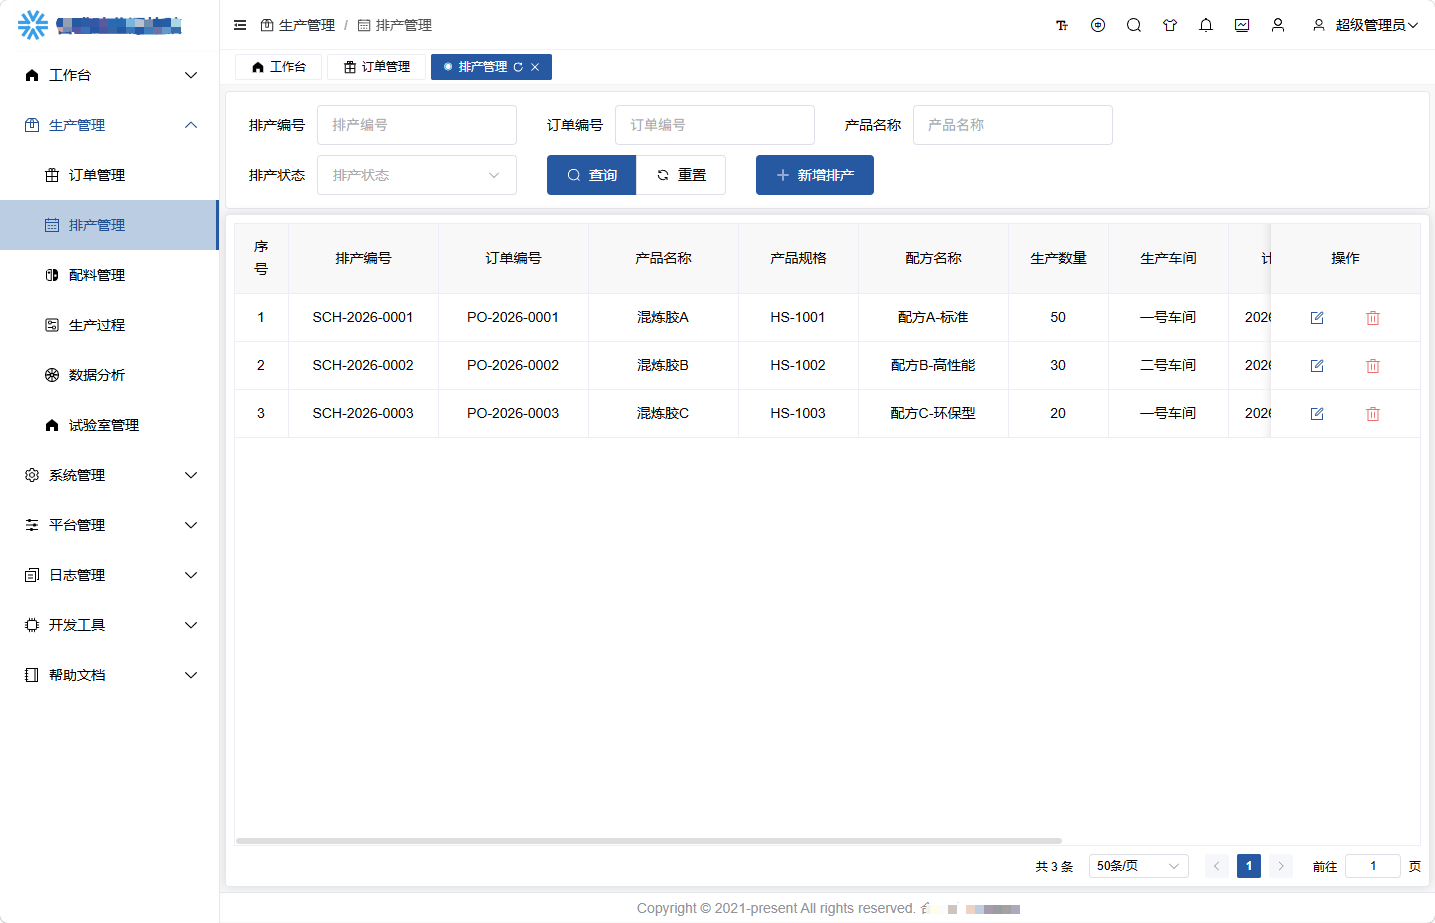
◇ Formula Selection: Establish a formula management database to support the creation, review, release and version update management of formulas. The system can automatically match formulas according to orders.
◇ Raw Material Schedule: After formula selection, the system automatically generates raw material schedules by referencing the raw material database. The database records raw material inventory levels, warehousing dates and material requisition records, and supports historical inventory query and retrieval.
◇ Production Scheduling Sheet: After formula selection, the system automatically generates production scheduling sheets based on data from the production process database.
◇ Production data will be generated automatically upon formula confirmation.
2.3 Batching Process
1.Generate electronic labels for raw rubber packaging based on the production raw material management database for unified management.
2.Labels shall be affixed to raw material containers (drums and cartons), transport tools and production equipment. The system conducts management and scheduling via labels to reduce errors and boost productivity.
3.Scan electronic labels to verify whether batch, quantity, weight and other information comply with production scheduling requirements. The system supports full tracking and early warning functions, eliminates manual checking errors during batching, and improves finished product quality.
2.4 Production Process
1.Realize automatic distribution of formula data to improve data accuracy.
2.Build a production process database to automatically collect production data and facilitate traceability of product quality defects.
3.Improve the level of process automation to reduce operators’ workload and enhance product quality.
4.Integrate product inspection data with process data to support product quality traceability.
5.Establish a finished product database for standardized finished goods management.
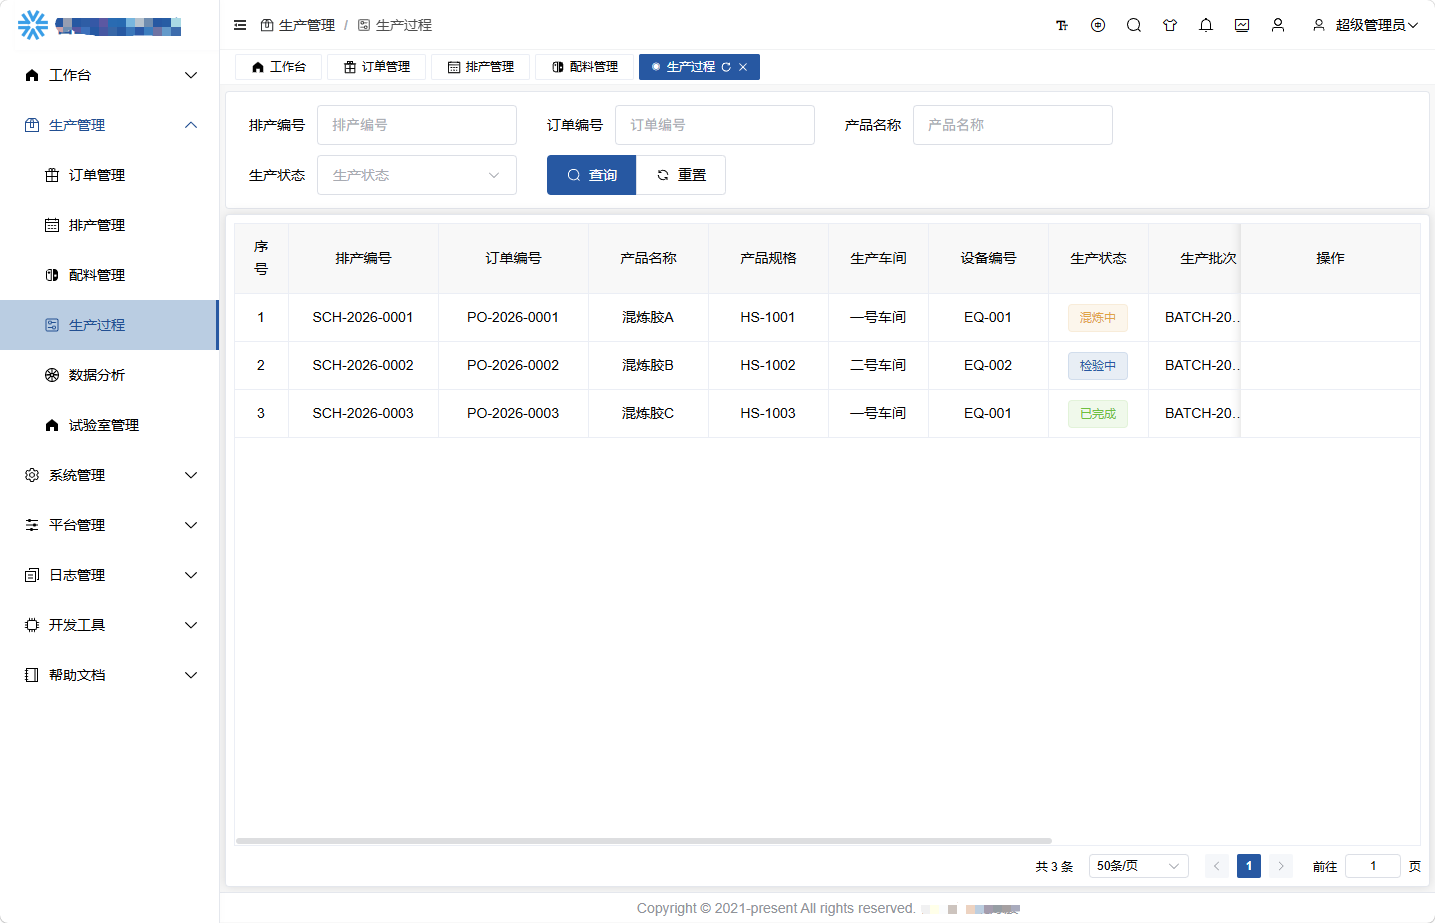
◇ Production Process Data Collection: Collect production process data and distribute formula data via OPC interfaces to build the production process database.
◇ Finished Product Warehousing Management: After finished product inspection, goods are stored by category, weight and other attributes with RFID tags; delivery notifications are triggered in accordance with order schedules.
◇ Production Process Traceability: All links of orders, including the whole production workflow, are traceable.
◇ Statistical Analysis: The database supports production process traceability as well as evaluation and prediction of product quality.
2.5 Statistical Analysis
1. Basic Statistical Reports
◇ Daily / Weekly / Monthly Production Order Reports: Daily summary of quantities of launched, completed, delayed and pending production orders.
◇ Statistics on overall capacity, hourly output, team output and production line capacity
◇ Plan fulfillment rate: Automatically calculated as actual output divided by planned output, with unfulfilled output gaps displayed
◇ WIP (Work-in-Progress) Statistics: Quantities and residence duration of semi-finished products backlogged at each process
◇ Completed Goods Warehousing Statistics: Breakdown of qualified warehousing, rework warehousing and outsourced product warehousing
2.5 Statistical Analysis
Basic Statistical Reports
◇ Daily / Weekly / Monthly Production Order Reports: Daily summary of quantities of launched, completed, delayed and pending production orders
◇ Statistics on overall capacity, hourly output, team output and production line capacity
◇ Plan fulfillment rate: Automatically calculated as actual output divided by planned output, with unfulfilled output gaps displayed
◇ WIP (Work-in-Progress) Statistics: Quantities and residence duration of semi-finished products backlogged at each process
◇ Completed Goods Warehousing Statistics: Breakdown of qualified warehousing, rework warehousing and outsourced product warehousing
2. Quality Data Statistics
◇ Daily defective product reports and defect classification statistics: appearance defects, dimensional defects, assembly defects and incoming material defects
◇ Statistics on First Pass Yield (FPY), throughput yield, rework rate, scrap rate and rework working hours
◇ Layered quality data of IQC (Incoming Quality Control), IPQC (In-Process Quality Control) and FQC (Final Quality Control)
◇ Defect work order traceability: match defective products with corresponding orders, equipment, operators and material batches
3. Visual Analysis Charts
◇ Capacity trend line chart: daily and weekly capacity fluctuations, comparison between off-peak and peak seasons
◇ Production line capacity bar comparison chart: horizontal load comparison of multiple production lines
◇ Pie chart / bar chart of order fulfillment rate: proportion classification of on-time, delayed and unstarted orders
Laboratory Data Management
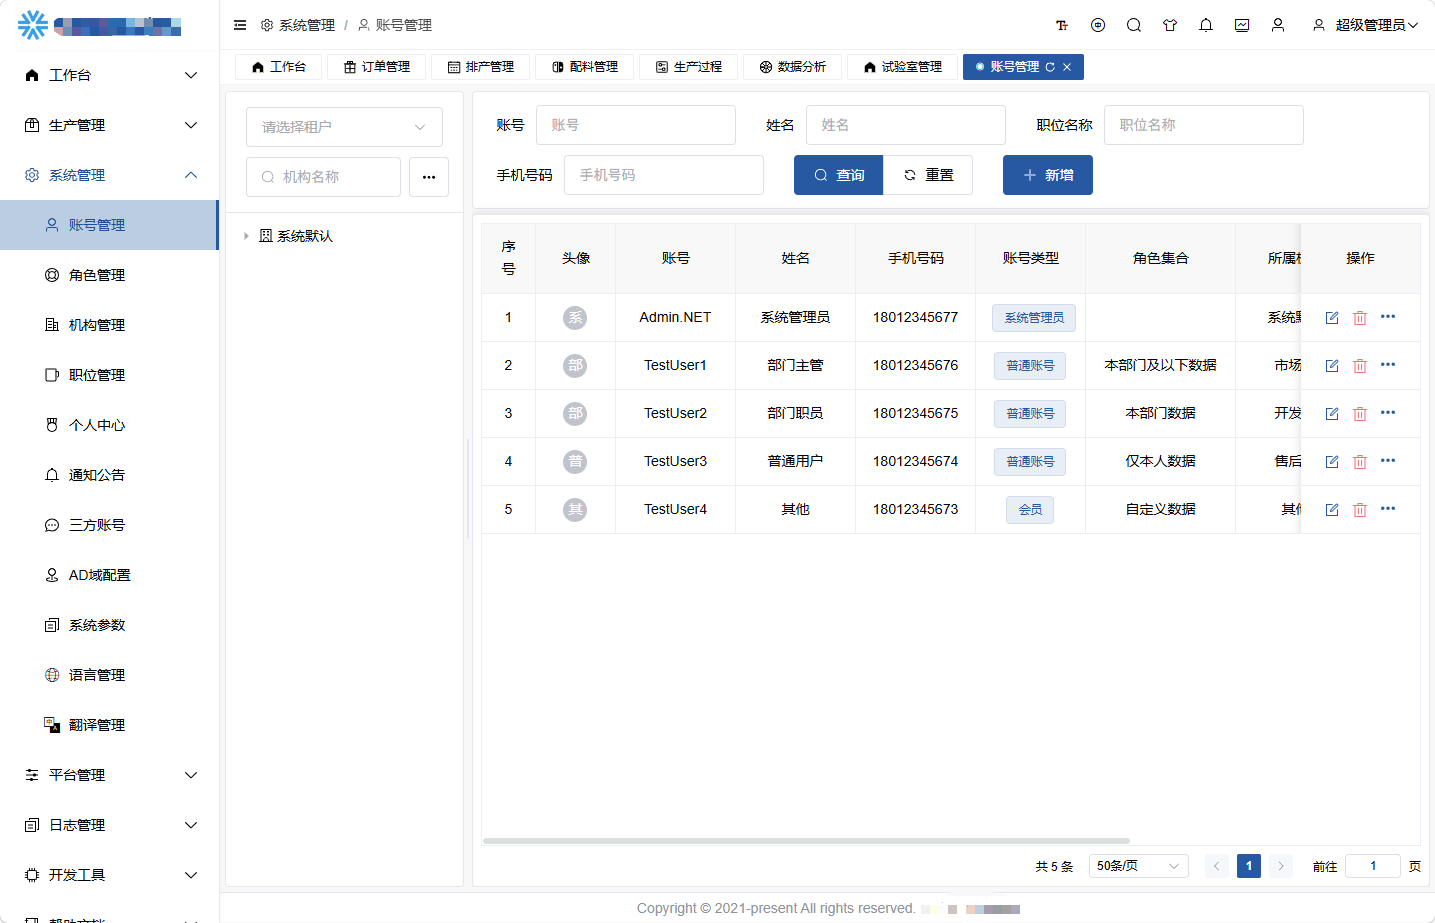
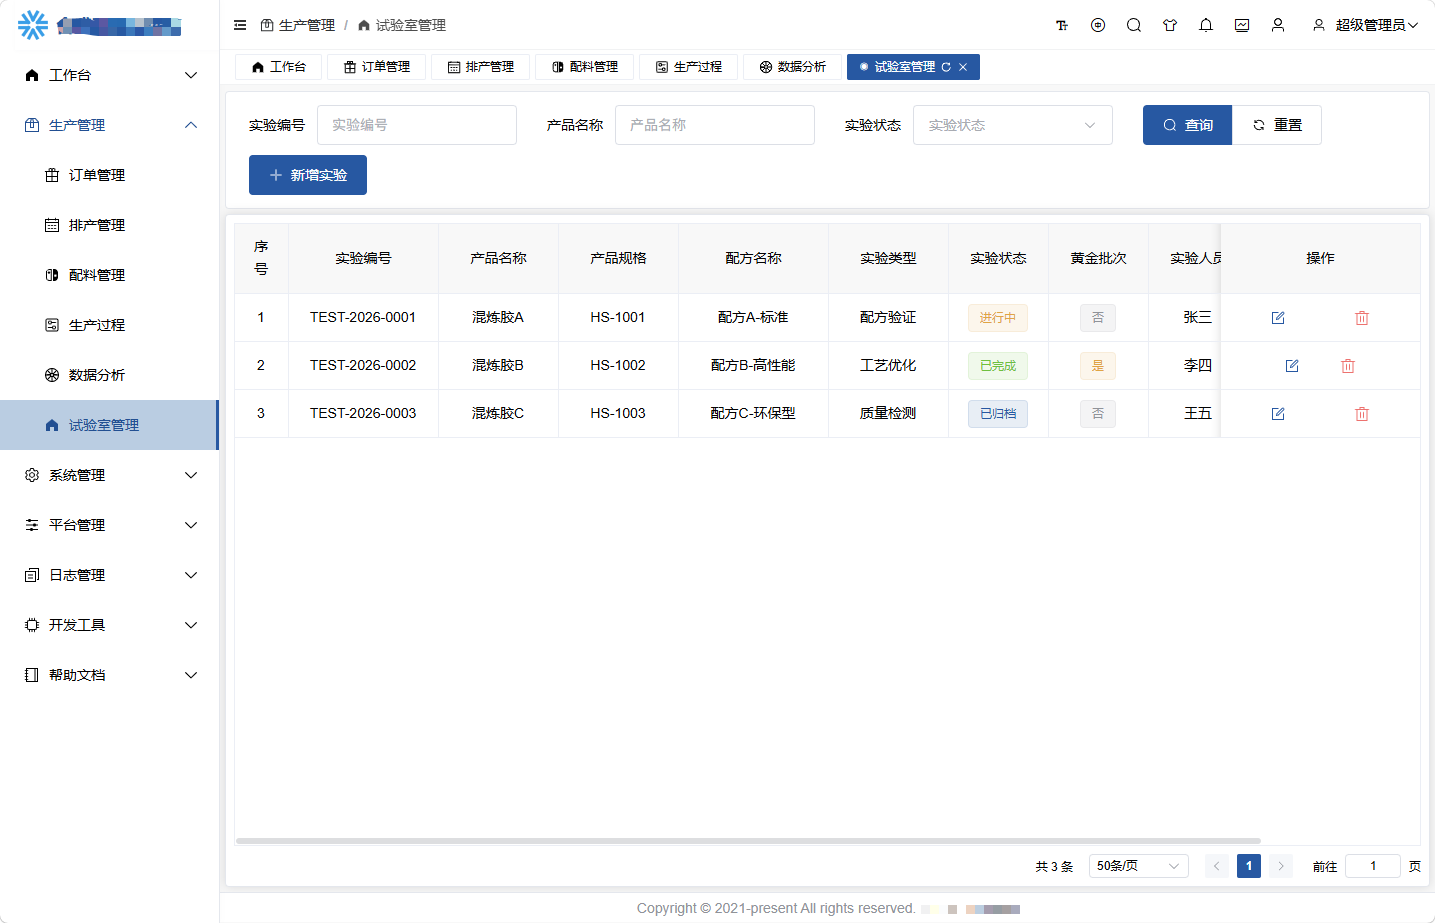
◇ In terms of laboratory data management, the system realizes three core functions: data collection and storage, data analysis and mining, as well as data application and feedback, so as to comprehensively improve R&D and production efficiency and product quality.
◇ The data collection and storage function automatically captures various data during experiments, such as test time, temperature and test results. The data are sorted and stored by pre-set rules to ensure systematic management and utilization of all key information.
◇ The data analysis and mining function adopts advanced data analysis algorithms to conduct in-depth analysis of experimental data. By comparing data from different test batches, it identifies optimal experimental conditions and parameter combinations, namely the so-called "golden batches", providing scientific support for product research and development and process improvement.
◇ The data application and feedback function establishes a correlation mechanism between experimental data and production data. It applies experimental results to actual production to guide the adjustment and optimization of production parameters for better product performance and quality. Meanwhile, test schemes are continuously optimized and adjusted based on production feedback to form closed-loop management.
3、Software Business Flow Diagram